MS Sho is *really* kool.
Been looking for a while for something like this. With all the fuss being made about data and stats these days it seemed odd to me that the MS camp didn't put out some r/ python-esque data analysis tools. Turns out I just wasn't looking in the right places. "Sho: the .NET Playground for Data" is a nifty, .net-friendly data analysis environment from MS research. It has a kool, R-feeling, console that makes for speedy data exploration.
 |
| From the start menu |
 |
| Sho console |
Generating data: Nifty random functions to generate data:
>>> x = rand(20)
>>> x
[ 0.9505 0.7515 0.7579 0.6926 0.7209 0.2979 0.3866 0.4590 ...4 cols... 0.5072 0.6721 0.9819 0.2756 0.0660 0.1953 0.9479 0.1866]
Reading data from a delimited file:
 |
| Use 'dlmreadJaggedArray' with a specified delimiter |
Reading data from SQL server (of course!):
 |
| Easiest thing ever - connecting to a local, default instance, using windows authentication, |
Ok so now some simple plots:
>>> x = rand(20)
>>> y = rand(20)
>>> plot(x)

>>> plot(x,'.')
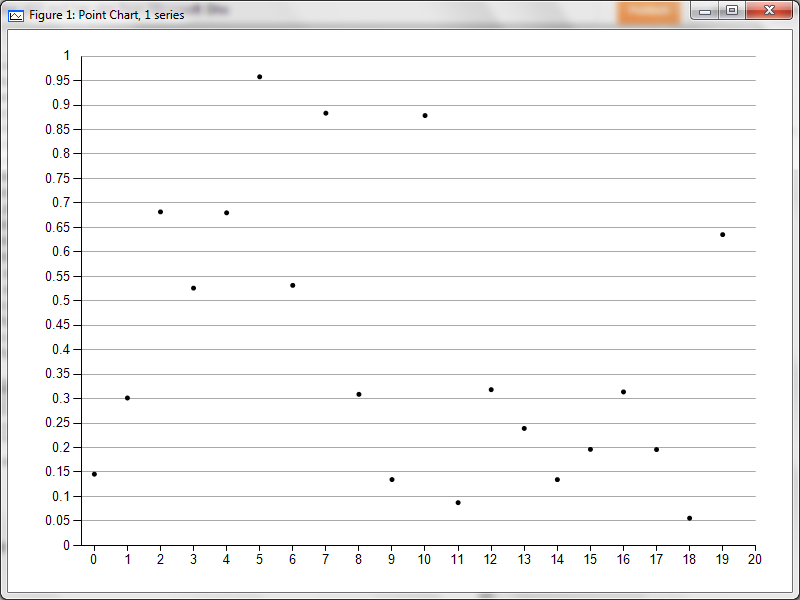
>>> plot(x,y,'.')

>>> bar(x)

>>> hist(x)
 |
| Notice the awesome "number of bins" slider!! |
so these commands pull up a new window with the plots, however!! you can use some 'show' commands to view the plots in the console itself (except for the histogram :/ )

So that's some Sho basics, but what's kool is that you can do all this from other .net languages!!
Here's how you make a histogram from c#:
DoubleArray y1 = ArrayRandom.RandomDoubleArray(20);
//histogram control
ShoHistControl hist1 = new ShoHistControl(y1, 6);
hist1.Width = 620;
hist1.Height = 460;
hist1.Location = new Point(1, 1);
//form to display histogram control
Form f1 = new Form();
f1.Text = "Histogram 1";
f1.Width = 640;
f1.Height = 480;
f1.MaximizeBox = false;
f1.Controls.Add(hist1);
f1.ShowDialog();
produces this:

basic scatter/ line/ bar plots are easier, you don't need to create a form to contain it, so this is all you need:
int[] x = { 1, 2, 2, 8, 2, 3, 2, 1 };
int[] y = { 1, 2, 3, 4, 5, 6, 7, 8 };
IFigure fig1 = ShoPlotHelper.Figure();
fig1.Plot(x, y, ".");
to produce this!:

So long story short, MS Sho is super fun and I for one am going to continue finding reasons to use it. One of the biggest advantages in my opinion is now I have a simple option for making quick, stand-alone dashboard applications which are easy to distribute to clients, something which was trickier to do with R.
Anyway folks, hope this is helpful to someone, any questions/ comments/ corrections are surely welcome.
oh P.S!! the guys at MS research did a great job of documenting all this, you can find out everything you need to know about Sho at their documentation page
update:
Plot from powershell!:
add-type -Path "C:\Program Files (x86)\Sho 2.1\bin\ShoArray.dll"
add-type -Path "C:\Program Files (x86)\Sho 2.1\bin\ShoViz.dll"
$r = 2.7
$x = 0.7
$x1 = 0
#number of iterations
$i=100
$i1 = $i
$points = [ShoNS.Array.FloatArray]::Zeros($i)
$xAxis = @()
while($i -gt 0){
$x1 = $r * ($x - ($x * $x) )
$points[$i1-$i] = $x1
$xAxis += @($i1-$i)
$x = [System.Decimal]::Parse($x1)
$i --
}
$vis = [ShoNS.Visualization.ShoPlotHelper]::Figure()
$vis.Plot($xAxis, $points)


